View statistics #
You can view the promotion statistics in the report, on the metrics dashboard, or the Promotion analytics tab.
Learn more about the “Promotion analytics” tab
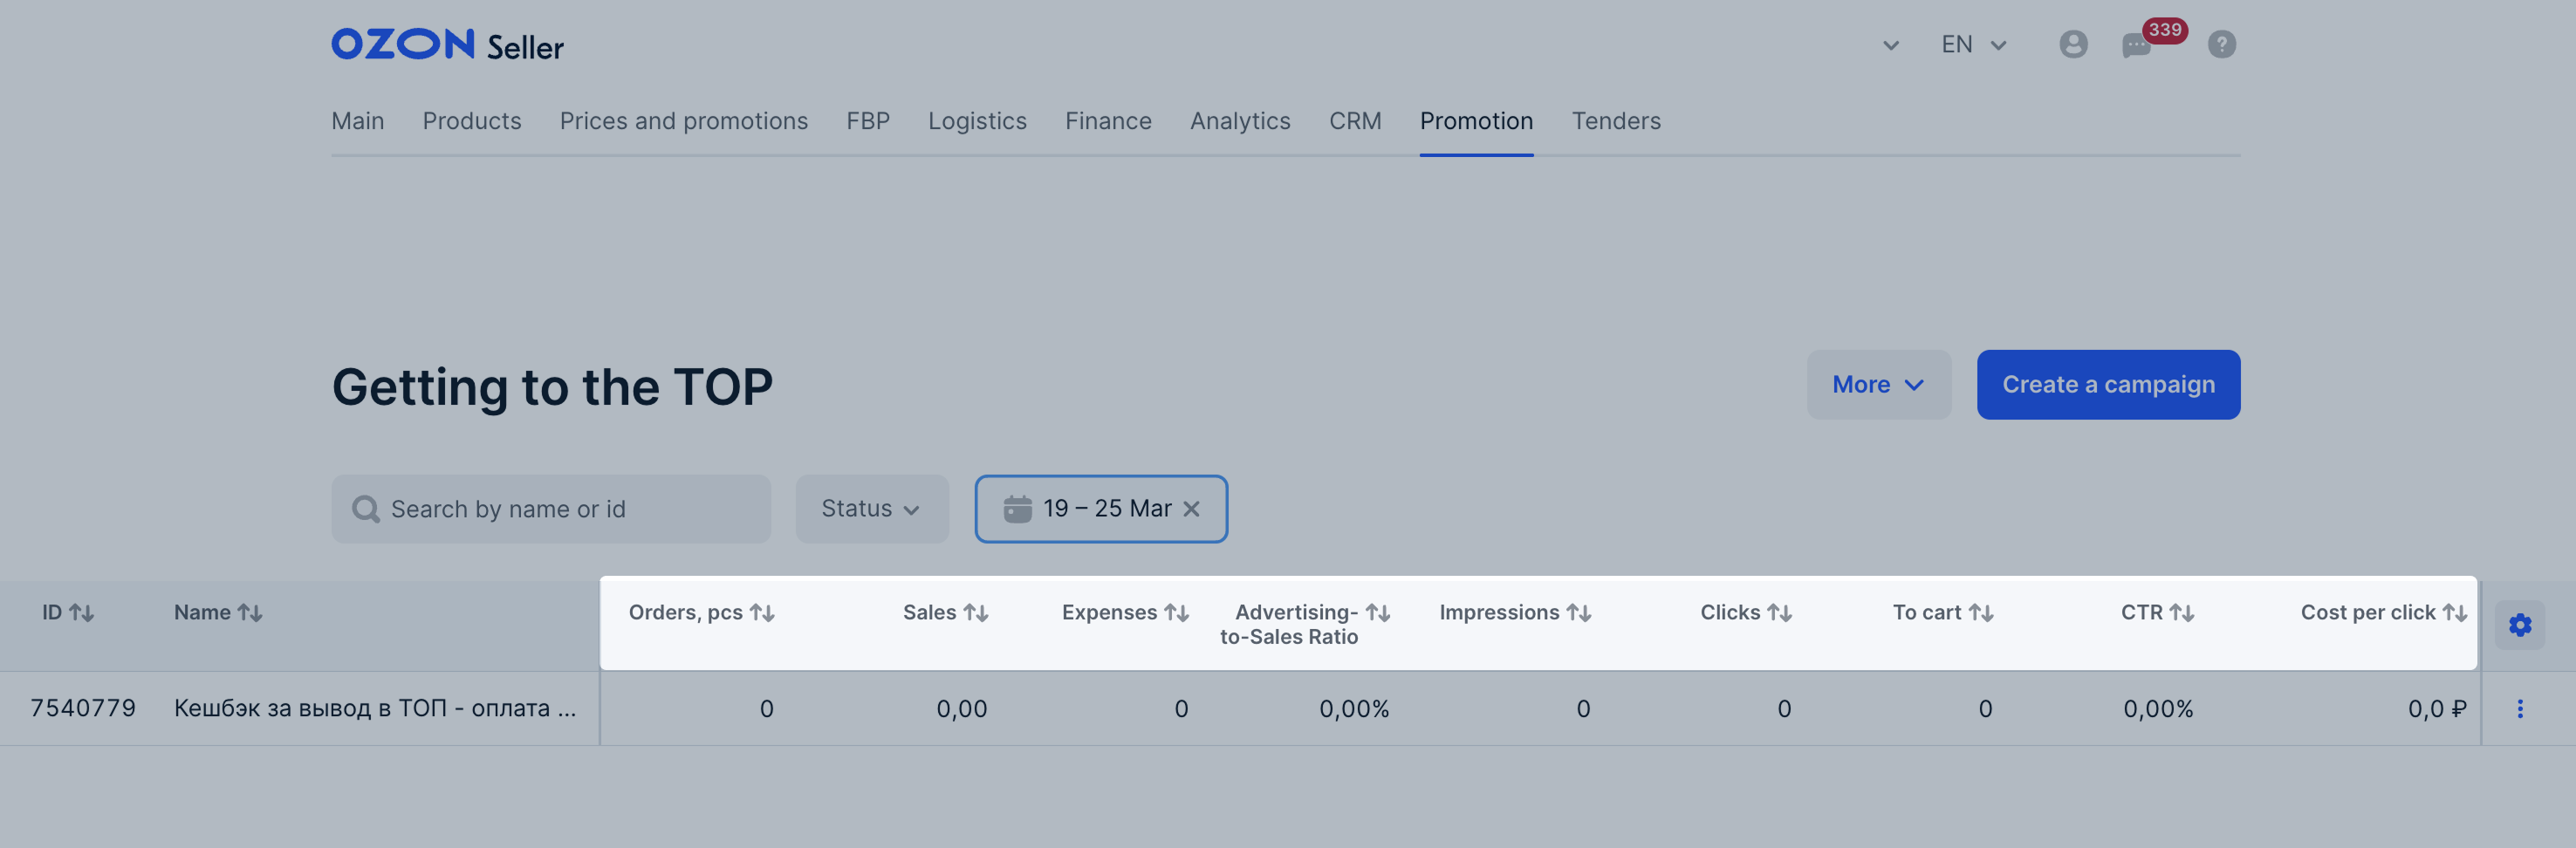
In the Promotion → Getting to the top section you can view period statistics for each product in the campaign:
- Orders: the number of orders received due to promotion.
- Sales: the number of sales received due to promotion.
- Expense: the costs of promoting this product for the selected period. The amount under the sum shows the share of costs for this product within the campaign.
- Impressions: the number of product displays at all stencil positions.
- Clicks: the number of clicks on the PDP.
- CTR (click-through rate): the ratio of the number of clicks to the number of impressions.
- Advertising-to-Sales Ratio: the ratio of the promotion expenses to the cost of products sold.
- Cost per click: calculated using the formula: product consumption ÷ the number of clicks on the product for the selected period.
- To cart: number of additions to cart for products with launched promotion.
- Date added: date when you added this product to the campaign.
You can find more details in the XLSX report.
Orders included in the campaign statistics #
The order is included in the statistics if a customer places it within:
- 10 days after clicking the PDP in the promoted position;
- 30 days after adding the product in the promoted position to the cart or favorites.
Once the customer pays for the order, it is displayed in the statistics. Postpaid orders are also included in the statistics. If a customer returns the prepaid order, it still remains in the statistics.
Example
A customer opens your PDP from their recommendations and then quits the app. Three days later, they find this product again and place an order with payment upon receipt. After another 15 days, the customer receives the order and pays for it. From that moment on, the order is displayed in the statistics.